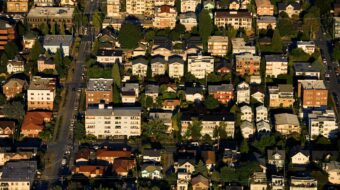
DHM/OVBC Survey Results
November 9, 2020
Although the divisive 2020 election may be over and there are just a few weeks left in a year of unprecedented challenges, don’t assume it is going to be smooth sailing for Oregon in 2021. A recent poll found 80% of Oregonians are ending the year worried about our state’s future and concerned about the continuing impacts of COVID-19, homelessness, racial injustice, riots, lawlessness, climate change and more.
What’s even more disconcerting is only 33% of us feel we can come together next year as Oregonians—urban and rural, Republican and Democrat, Whites and communities of color—to make progress addressing these challenges and resetting Oregon.
These findings come from a DHM Research (DHM) and Oregon Values and Beliefs Center (OVBC) online survey conducted from October 1 to October 6, 2020 about a variety of issues including COVID-19, climate change, homelessness, and public finance and taxation. Quality control measures were taken including pretesting the questionnaire and randomizing questions to reduce order bias. Demographic quotas and statistical weighting were also used to ensure a representative sample of 600 Oregonians ages 18+. The margin of error for each question falls between +/-2.4% and +/-4.0% at the 95% confidence level, depending on how the response category percentages split for any given question.
Four out of every five Oregonians are worried about Oregon’s future.
Survey respondents who were worried about Oregon’s Future were asked to describe their worry in 10 words or less. Following are some representative responses:

Worries like these extend across the state with women and younger Oregonians being most worried about Oregon’s future.
Only about a third of Oregonians believe we can come together to address our state’s challenges.
About a third of Oregonians (32%) do not believe we can come together as Oregonians—urban and rural, Republican and Democrat, Whites and communities of color—and make progress addressing our state’s challenges. An addition 35% are not sure.
Republicans are the most likely to feel we can not come together as are Oregonians living in the rest of state.
There is a strong difference in feelings by age with Oregonians ages 18-44 feeling more optimistic that we can come together (42%-51%) compared to ages 45+ (21%-22%).
Men are more likely to feel we cannot come together (39% vs. 26%) while women were more likely to be unsure (43% vs. 27%).
The challenges Oregon faces post-election are numerous and complex. What makes the task of addressing these challenges more daunting is the belief that we cannot come together to get the job done. Our leaders are in for a real test that will reward coalition building across the private, public, and non-profit sectors and good communications with all Oregonians, including those residing in rural areas of the state and communities of color.
The research was completed as a community service by DHM Research in partnership with the Oregon Values and Beliefs Center. Both organizations are independent and non-partisan. DHM Research is a Certified B Corporation (www.dhmresearch.com) and OVBC is an Oregon charitable nonprofit corporation (www.oregonvbc.org).
DHM/OVBC–Annotated–October 2020.pdf DHM/OVBC–Crosstabs–October 2020.pdfMonths have passed since COVID-19 initially spread across the globe. The response and feelings towards the pandemic have greatly varied depending on location and belief systems. Many people have come to adopt new behaviors to help us overcome the risk of exposure to the virus. However, the effects of the pandemic are well beyond physical health as thousands of families and businesses continue to experience the financial impact of the global pandemic. Each month since the pandemic began, DHM has tracked Oregonians’ views and opinions of the virus and how elected leaders have responded to it. In this month’s panel, we check-in with Oregonians to trace the patterns in opinion overtime.
These findings come from a DHM Research (DHM) and Oregon Values and Beliefs Center (OVBC) online survey conducted from October 1 to October 6, 2020 about a variety of issues including COVID-19, climate change, homelessness, and public finance and taxation. Quality control measures were taken including pretesting the questionnaire and randomizing questions to reduce order bias. Demographic quotas and statistical weighting were also used to ensure a representative sample of 600 Oregonians ages 18+. The margin of error for each question falls between +/-2.4% and +/-4.0% at the 95% confidence level, depending on how the response category percentages split for any given question.
COVID-19 remains a top tier issue that Oregonians want addressed by their elected leaders.
When asked to indicate which issue is most important for elected leaders to address, Oregonians list law enforcement (19%), the environment (14%), and COVID-19 (11%) most often.
Although the degree of importance to address COVID-19 has fallen below law enforcement and the environment, creating a plan to address the coronavirus has remained one of the top three issues for Oregonians since the virus appeared in March.
About half of Oregonians are still worried about their personal financial situation due to COVID.
DHM survey results from March indicated that a majority of Oregonians (63%) were somewhat (40%) or very (23%) worried about their personal financial situation. Results from DHM’s April Panel Survey revealed that a majority of Oregonians were worried about the personal financial impact that COVID-19 would have on them. More than half (56%) of Oregonians were very (19%) or somewhat (37%) worried about their personal financial situation in the month of April. October’s panel results indicate that a similar proportion of Oregonians (53%) are still very (19%) or somewhat (33%) worried about their personal financial situation. Results from surveys conducted by DHM in June and September reveal that the level of worry among Oregonians has remained fairly consistent.

Around half of Oregonians are worried that COVID-19 may infect them, a member of their household, or someone under their care.
Oregonians were first asked by DHM how worried they were about personally becoming infected by COVID-19 in April 2020. They were also asked how worried they were that a member of their household or someone who relies on their support for medical care would become infected by COVID-19. We have asked Oregonians this same set of questions in the October panel to observe the change over time.

Nearly half of Oregonians (47%) indicate that they are very (12%) or somewhat (35%) worried about personally being infected by the virus. The proportion of Oregonians who are worried about personally becoming infected has remained fairly constant since April 2020 (45%).
More than half of Oregonians (55%) are very (23%) or somewhat (32%) worried that a member of their household will be infected by COVID-19. This level of concern is consistent with data from DHM’s April Panel where 55% of Oregonians were very (24%) or somewhat (31%) worried about members of their household becoming infected by the virus.
Four in ten (43%) Oregonians are very (16%) or somewhat (27%) worried that someone who would rely on them for support for medical care will become infected with COVID-19. This percentage has decreased slightly since DHM’s April Panel when 48% of Oregonians were very (20%) or somewhat (28%) worried about people who they medically support becoming infected with COVID-19.
More than half of Oregonians believe that the FDA will approve a vaccine for COVID-19 sometime next year.
A majority of Oregonians (54%) think that the FDA will approve a vaccine for COVID-19 sometime next year. About one in six Oregonians (15%) believe that the FDA will approve a vaccine sometime between the election and the end of the year, while fewer Oregonians believe that a vaccine will be approved sometime after next year (9%) or before the November election (3%). However, nearly one in five (19%) Oregonians say they don’t know when a vaccine will be approved.

Belief about the timeline of the FDA’s approval for a vaccine differ by area of state, age, race, party, and education.
Oregon residents in the Tri-county (65%) area are more likely to believe the vaccine will be approved sometime next year compared to the Willamette Valley (48%) and the rest of the state (41%). About one in four residents living in the rest of state (23%) are also more likely to believe that a vaccine will be approved between the election and the end of the year.
Oregonians ages 65+ (70%) are more likely to believe that a vaccine for COVID-19 will be approved sometime next year compared to their younger counterparts (46%-53%). White people (56%) were also more likely to hold this belief than people of color (38%).
Democrats (70%) are also more likely to believe that a vaccine will be approved sometime next year, while those who identify as Independent/Other (49%) and Republicans (35%) are less likely to think that a vaccine will be approved sometime next year.
College graduates (72%) are also more likely to believe that a vaccine for COVID-19 will be approved sometime next year compared to people who have obtained some college education (47%) or those who have a high school diploma or less (47%).
Results from a similar survey conducted by DHM in September indicated that a majority of Oregonians (67%) would definitely (39%) or probably (28%) get the vaccine when it becomes available.
DHM/OVBC–Annotated–October 2020.pdf DHM/OVBC–Crosstabs–October 2020.pdfDHM/OVBC Survey Results
November 8, 2020
Homelessness is an important and urgent concern among Oregonians across the state. Fully half of Oregonians believe leaders should make solving homelessness their top priority and they place responsibility squarely on the shoulders of local and state government leaders. The public views mental illness, substance abuse, and lack of affordable housing as the key drivers of homelessness. Despite the persistence and severity of homelessness, Oregonians haven’t given up hope. More than half the public believes homelessness is a problem that can be solved with the right mix of policies and resources.
These findings come from a DHM Research (DHM) and Oregon Values and Beliefs Center (OVBC) online survey conducted from October 1 to October 6, 2020 about a variety of issues including COVID-19, climate change, homelessness, and public finance and taxation. Quality control measures were taken including pretesting the questionnaire and randomizing questions to reduce order bias. Demographic quotas and statistical weighting were also used to ensure a representative sample of 600 Oregonians ages 18+. The margin of error for each question falls between +/-2.4% and +/-4.0% at the 95% confidence level, depending on how the response category percentages split for any given question.
Half of Oregonians feel strongly that addressing homelessness should be the number one priority in their local community.
One in two Oregonians (50%) believe it is either very important (28%) or urgent (22%) that leaders in their community make solving homelessness their number one priority. Residents of the Tri-county area consisting of Clackamas, Multnomah, and Washington counties (56%), and of the remainder of the Willamette Valley (51%), are more likely than residents of the rest of the state (41%) to hold this view. Democrats (57%) and non-affiliated voters (51%) are also more likely than Republicans (38%) to share this priority. Despite these regional and partisan differences, the expectation that community leaders address homelessness is widely shared.

Oregonians consider mental illness, substance abuse, and lack of affordable housing as the primary drivers of homelessness.
When asked to identify the top three drivers of homelessness from a list of over a dozen potential causes, Oregonians most often cited mental illness (59%), substance abuse (59%), and lack of affordable housing (44%). While a majority of residents across the state view mental illness and substance abuse as key drivers, there is less regional consensus when it comes to lack of affordable housing as a perceived cause of homelessness. Residents of the Tri-county area (50%) are more likely to point to a lack of affordable housing than other residents of the Willamette Valley (40%) and of residents of the rest of the state (37%).

Partisan differences are apparent when Oregonians are asked whether homelessness is a result of personal choice, with Republicans (41%) more likely to cite it as a factor than non-affiliated (24%) and Democratic (11%) voters. Still, a majority of Republicans acknowledge the impact of both substance abuse (76%) and mental illness (61%) as drivers of homelessness.
Despite their differences, Oregonians clearly view the causes of homelessness as multifaceted, suggesting they want a comprehensive strategy to address it, which prioritizes both mental health and substance abuse treatment, but also includes increasing the supply of affordable housing.
Oregonians expect state and local governments to create solutions to homelessness.
Provided with a list of fifteen entities that might bear some responsibility for creating solutions to homelessness, most Oregonians agree: responsibility rests primarily with local (94%) and state (93%) government as well as local (92%) and state (90%) elected officials.
Democrats are more likely to place greater responsibility on housing developers and landlords as needing to play a role in addressing homelessness. Nearly nine in ten Democrats (86%) believe housing developers bear some responsibility, while fewer non-affiliated voters (56%) and Republicans (54%) do so. Similarly, approximately eight in ten Democrats (76%) consider landlords responsible, as opposed to fewer non-affiliated voters (62%) and Republicans (45%).

A majority of Oregonians view homelessness as a problem that can be solved.
Despite the persistence of homelessness as a problem, a majority of Oregonians (57%) remain optimistic that with the right mix of policies and resources, it is a problem that can be solved. That said, optimism is higher among Democrats (69%), than among non-affiliated voters (55%), and Republicans (39%). Optimism is also greater among younger residents ages 18–29 (66%) and ages 30–44 (63%), than among older residents ages 45–64 (51%) and age 65+ (49%).

In conclusion, a majority of Oregonians believe that homelessness is a problem that can be solved––and they expect their local and state leaders to develop effective strategies for tackling the problem. Oregonians view mental illness, substance abuse, and the lack of affordable housing itself as the root causes of homelessness. While they prioritize mental illness and substance abuse more heavily than the lack of affordable housing, they nevertheless consider all three as the top drivers of homelessness. Oregonians appear open, therefore, to a comprehensive solution to homelessness that includes a mix of both mental health and substance abuse treatment as well as an increased supply of affordable housing.
The research was completed as a community service by DHM Research in partnership with the Oregon Values and Beliefs Center. Both organizations are independent and non-partisan. DHM Research is a Certified B Corporation (www.dhmresearch.com) and OVBC is an Oregon charitable nonprofit corporation (www.oregonvbc.org).
DHM/OVBC–Annotated–October 2020.pdf DHM/OVBC–Crosstabs–October 2020.pdfDHM/OVBC Survey Results
November 8, 2020
Reports of warmer weather, rising sea levels, and the increase of extreme natural events have all been indicators of global climate change. However, many people continue to question whether there is enough evidence to support the claim that climate change exists. Regardless of people’s view on climate change, the bigger question is how to combat it. If climate change does really exist, are we prepared to change our lives to stop it? In this month’s panel, we ask Oregonians about their perceptions and views of climate change and how Oregon should respond.
These findings come from a DHM Research (DHM) and Oregon Values and Beliefs Center (OVBC) online survey conducted from October 1 to October 6, 2020 about a variety of issues including COVID-19, climate change, homelessness, and public finance and taxation. Quality control measures were taken including pretesting the questionnaire and randomizing questions to reduce order bias. Demographic quotas and statistical weighting were also used to ensure a representative sample of 600 Oregonians ages 18+. The margin of error for each question falls between +/-2.4% and +/-4.0% at the 95% confidence level, depending on how the response category percentages split for any given question.
Three in four Oregonians believe that there is solid evidence that the average temperature on earth has been getting warmer.
A majority of Oregonians (77%) believe that the average temperatures on Earth have been rising because of human activity (59%) or because of natural patterns in earth’s environment (18%). However, nearly one in five Oregonians (17%) do not believe that there is solid evidence because we don’t know enough yet (12%) or it just isn’t happening (5%).

There has been a slight shift in Oregonians’ belief on climate change overtime. The proportion of Oregonians who believe that climate change isn’t happening has decreased from 12% in 2018 to 5% in 2020. The proportion of Oregonians who believe that average temperatures on Earth are getting warmer because of human activity has slightly increased since 2018 (52%), with nearly six in ten (59%) Oregonians sharing this belief in 2020.
These beliefs are starkly different by area of the state, political party, and educational attainment.
Residents in the Tri-county area (83%) are more likely to agree that there is solid evidence to support warmer temperatures compared to residents in the Willamette Valley (74%) and the rest of the state (69%).
Members of the Democratic (97%) party are also more likely to hold this belief compared to Republicans (52%) and Independents/Others (71%). Oregonians with a college degree (88%) are also more likely to hold this belief compared to Oregonians with some college education (70%) and people with a high school diploma or less (75%).
A majority of Oregonians are concerned that global climate change will harm them personally at some point in their lifetime.
Six out of ten Oregonians (64%) are very (37%) or somewhat (26%) concerned that global climate change will personally harm them at some point in their life. Three out of ten (34%) Oregonians are not too (17%) or not at all (17%) concerned that global climate change will personally harm them.
The level of concern among Oregonians has increased from 56% since we last asked this same question in 2019. Level of concern varies by area of state, age, education, and political party.
Residents in the Tri-county area are more concerned (72%) about global climate change than residents in the Willamette Valley (62%) and the rest of the state (53%). Oregonians between ages 18–29 (77%) are also more concerned when compared to older Oregonians (53%–64%). College graduates (75%) are more concerned about personally being harmed from climate change than Oregonians with some college education (56%) and people with a high school diploma or less (64%). The greatest contrast in the level of concern is between political parties.

A majority of Democrats (88%) and members of the Independent/Other (63%) parties are more likely to be concerned that global climate change will personally affect them at some point in their lifetime compared to a majority of Republicans (73%) who are not concerned about climate change.
A majority of Oregonians agree the state should take additional steps to combat climate change but less than half of the state is prepared to pay higher taxes for goods and services to fund it.
Six out of ten Oregonians (62%) agree that Oregon should take additional steps to help combat climate change while three out of ten do not think we should take additional steps (26%) or are unsure (12%). However, Oregonians are split when it comes to being prepared to pay higher taxes to combat climate change (46%) or not (40%).

The level of agreement varies by area of the state, political party, and educational attainment.
A majority of Oregonians (56%–67%) across the state believe that we should take additional steps to combat climate change. However, residents in the Tri-county area (59%) are more prepared to pay additional taxes for goods and services while residents in the Willamette Valley (48%) and the rest of the state (49%) are not.
Nearly all of Oregon’s Democrats (88%) and a majority Independents/Others (60%) believe that we should take additional steps to combat climate change while a majority of Republicans (61%) believe that we should not. A majority of Democrats (73%) are also prepared to pay higher taxes for goods and services compared to Republicans (12%) and Independents/Others (42%).
More than half of Oregonians (53%–71%) believe that we should take additional steps to combat climate change, regardless of their level of educational attainment. However, college graduates (69%) are more prepared to pay higher taxes for goods and services compared to Oregonians who have some college education (41%) and people with a high school diploma or less (34%).
The research was completed as a community service by DHM Research in partnership with the Oregon Values and Beliefs Center. Both organizations are independent and non-partisan. DHM Research is a Certified B Corporation (www.dhmresearch.com) and OVBC is an Oregon charitable nonprofit corporation (www.oregonvbc.org).
DHM/OVBC–Annotated–October 2020.pdf DHM/OVBC–Crosstabs–October 2020.pdfDHM Survey Results
October 26, 2020
These findings come from a DHM Research (DHM) and Oregon Values and Beliefs Center (OVBC) online survey conducted from October 1 to October 6, 2020 about a variety of issues including COVID-19, climate change, homelessness, and public finance and taxation.
Quality control measures were taken including pretesting the questionnaire and randomizing questions to reduce order bias. Demographic quotas and statistical weighting were also used to ensure a representative sample of 600 Oregonians ages 18+. The margin of error for each question falls between +/-2.4% and +/-4.0% at the 95% confidence level, depending on how the response category percentages split for any given question. The percentages report below may not add to 100% because of rounding.
Taxation for Public Services
Oregonians are split in their feelings about taxes and public services with about a third each feeling we spend too much on public services and taxes should be reduced (31%) and another third feeling we spend about the right amount and taxes should remain the same (32%). About a quarter of Oregonians (23%) feel we do not spend enough on public services and taxes should be increased, and 15% were unsure.

Tri-county and Democrats were more likely than their counterparts to feel that Oregon does not spend enough on public services and taxes should be increased. Women were less likely than men to feel Oregon spends too much on public services. Women were also more likely to be unsure as were respondents ages 18-44.
This split in feelings about what we spend on public services has been with us for a while. In 2013, the numbers were similarly split: 30% too much, 31% right amount, 28% not enough, and 10% unsure.
Oregonians feel that both small businesses and individuals pay about the right amount (30%/31%) or too much (46% 48%) in Oregon state taxes. On the other hand, they feel large businesses pay too little (61%). Across all three groups (small businesses, large businesses, individuals), Tri-county and Democrats were more inclined than their counterparts to feel the group is paying too little in taxes.
Importance of Public Services
Respondents were asked to indicate the importance of 21 different public services ranging from public safety like police to 4-year colleges—see attachment below. They were provided the following information to use for their ratings:
- Very or somewhat important means you would support some increase in your taxes to increase the service or some reallocation of tax dollars away from other existing services
- Neutral means you do not want more tax dollars to go to that service even if that means a diminished level of the service over time
- Somewhat or very unimportant means you want fewer or no taxes to go to that service now and that it should be reduced or discontinued entirely
Considering combined very or somewhat important, the highest rated services were fire protection (77%), protection of water and air quality (75%), and emergency disaster and preparedness (73%). K-12 education was 70% followed by two at 69%: public health including disease prevention, and road and highway maintenance.

Three of these services were rated by more than 40% of Oregonians as very important: protection of water and air quality (48%), K-12 education (47%), and fire protection (43%). Only one other service was above 40% very important: publicly funded health insurance for all citizens (42%).
Rated least important was economic development like subsidies and tax breaks for business attraction or expansion (30% combined very or somewhat important). It also had the highest very unimportant rating (14%).
Following are some observations for different service areas:
Education: Importance ratings (very or somewhat) ranged from a high of 70% for K-12 education to 44% for 4-year colleges and universities. Rated similarly were vocational and technical training/retraining (60%) and community colleges (56%).
Transportation: Road and highway maintenance was rated higher (69% very or somewhat important) than public transportation like buses and trains and new roads and highways, both 50%. Public transportation had a higher very important rating than new roads and highways (20% vs. 15%).
Public Safety: Support for the police has likely fallen since a 2013 baseline figure that included them as part of public safety along with fire protection. 77% rated fire protection very or somewhat important compared to only 55% for public safely like police. The police have been caught in the middle with some Oregonians feeling that some are racists even wanting police services defunded to others feeling they’ve not doing enough about the riots and property damage.
Environment: Protection of water and air quality was one of the highest rated services. Only fire protection was rated higher. It had the lowest neutral rating and a majority of every demographic subgroup rated it very or somewhat important, including Republicans (60%).
Economic Development: Though subsidies and tax breaks for business attraction or expansion was the lowest rated service, it received the highest neutral rating and the most polarization with 30% rating it very or somewhat important and 32% rating it somewhat or very unimportant.
This October 2020 research benchmarked findings from the 2013 Oregon Values and Beliefs Study. The list of services was the same except that fire protection was separated out from police, and one additional service was included: public health including disease prevention. Following are two highlights from a comparative analysis.
- A decline in support, or at least in willingness to pay more for education, from K12 through higher education
- Four services saw significant increases in willingness to pay more: publicly funded health insurance for all citizens, low income support services, emergency disaster & preparedness, and public transportation like buses and trains. All four of them have a connection with the public health and economic impact of COVID-19.
The research was completed as a community service by DHM Research in partnership with the Oregon Values and Beliefs Center. Both organizations are independent and non-partisan. DHM Research is a Certified B Corporation (www.dhmresearch.com) and OVBC is an Oregon charitable nonprofit corporation (www.oregonvbc.org).
Importance of Public Services Attachment.pdf DHM/OVBC–Annotated–October 2020.pdf DHM/OVBC–Crosstabs–October 2020.pdfSeptember 11, 2020
From September 3 to 8, 2020, DHM Research conducted a survey of Oregon voters. The purpose of the survey was to assess values and beliefs related to the presidential election, ongoing protests across the country and in Portland, and COVID-19.
This is the second of three planned data releases and focuses on Oregon voters’ preferences in the presidential election, impressions of key political leaders, and an update to their attitudes about COVID-19.
Joe Biden leads Donald Trump by 12 points among Oregon voters.

Biden leads Trump 51% to 39%, a 12-point margin. This is nearly the exact outcome of the 2016 election in Oregon, where Clinton defeated Trump 50% to 39%. As much has changed, Oregon voters’ presidential preferences seem immovable.
It is no surprise at this point that Trump has Republican voters solidly behind him. 91% of Republicans plan to vote for Trump while 5% plan to vote for Biden. Likewise, Biden has locked down the Democratic vote. 87% of Democrats plan to vote for Biden while 8% expect to vote for Trump. Non-affiliated/other (NAV/other) voters lean towards Biden, with 47% planning to vote for the Democratic candidate and 31% for Trump.
The geographic and demographic support for the two candidates is also not surprising. Biden is winning the Portland metro area (59%) and Willamette Valley (52%), and Trump is winning the rest of the state (55%). By age, Biden has a solid majority among voters ages 18-29 (57%) and 30-44 (61%), while Trump is narrowly ahead among voters ages 45-64 (48%) and 65+ (49%). Men are split, with Biden getting 48% to Trump’s 46%, while women lean more heavily toward Biden (53% vs. 32%), though more women are open to voting for a third party or remain undecided (15%).
Education has become an increasing divide in politics and the presidential election, with Democrats and Biden performing better among voters who have completed more education while Republicans and Trump are favored by those with less education. Among college graduates, Biden is leading by 29 points (62% vs. 33%), while Trump is leading by 7 points with those with a high school degree or less (46% vs. 39%).
Oregon voters view Biden more positively than Trump.

52% of Oregon voters have a positive impression of Biden compared to 45% who view him negatively, a positive lean of 7 points. Among Biden voters, 93% view him positively and 7% negatively. 6% of Biden voters view Trump positively.
On the other hand, 39% of Oregon voters have a positive impression of Trump compared to 60% who view him negatively (53% “very” negative), a negative lean of 21 points. Among Trump voters, 93% also view him positively and 7% negatively. Just 2% of Trump voters view Biden positively.
DHM Research has tracked impressions of Trump since October 2016. Negative impressions have ranged from 55% (October 2018) to 68% (October 2019). His current 60% negative rating is about average for his first term.
A majority of Oregon voters have a negative impression of Kate Brown.

51% of Oregon voters have a negative impression of Brown compared to 43% who view her positively. Impressions of her have been stable the last few years, but they are much more negative than when she first came into office. DHM Research first started tracking her in April 2015 when just 15% of voters viewed her negatively. Negative impressions of her increased the following years, with little change to her positive ratings, and she has had negative ratings since June 2019.
Oregon voters give poor marks to the state’s economic conditions but are relatively positive about their personal financial situations.

77% of voters rate Oregon’s current economic conditions as only fair (54%) or poor (24%), while just 21% feel that economic conditions are good (19%) or excellent (2%). Moreover, voters are five times more likely to say that the state’s economic conditions are getting worse (46%) than say they are getting better (9%).
Surprisingly, there is little to no difference in how voters rate the state’s current economic conditions by income or education levels, Biden or Trump supporters, or political party.

Despite these poor ratings of the state’s economy, Oregonians are feeling better about their personal finances than just about any time in the last decade. Since 2011, DHM Research has asked Oregonians how worried they are about their personal financial situation. The percentage of people saying that they are very or somewhat worried peaked in 2012 at 69%. Worry fell to 50% in late 2019. Worry spiked again at the start of the COVID-19 lockdowns, jumping to 63% in March. Since then, worry has ebbed and now for the second time since June “only” 49% of Oregonians say that they are very or somewhat worried.

Likely reasons for the decline in worry is a combination of enhanced federal unemployment benefits and a lack of ways to spend money during the pandemic. It has now been over a month since the $600 per week UI payments stopped but we are yet to see an uptick in Oregonians’ financial worries.

Voters who live in households where someone has lost a job or income due to COVID-19 are the most worried about their financial situations (73%). Other voter groups worried about their financial situations include those ages 18-29 (71%), have a high school degree or less (62%), incomes less than $25,000 (59%), and women (59%).
Oregonians continue to be worried about the spread of COVID-19 in their communities.


Other groups that are generally more worried are voters of color (82%), those ages 18-29 (76%), college graduates (75%), and women (71%). Groups somewhat less worried are those ages 45-64 (61%) and those with a high school degree or less (61%).
3 in 4 voters believe that the spread of COVID-19 in their communities is either staying about the same or getting better. Just 20% think that it is getting worse.

Despite little change in Oregonians’ worry about COVID-19, the vast majority do not think the spread of the virus is getting worse. And there is little difference by area of the state, with just 18% of voters in the Portland metro area and Willamette Valley, and 24% in the rest of the state, believing that the spread is getting worse.
A majority of Oregon voters approve of how Governor Brown, local elected officials, and local school districts are responding to COVID-19, while most disapprove of President Trump’s response.

Voters’ assessments of how elected leaders are responding to COVID-19 have become increasingly partisan. Oregon Democrats, for example, largely approve of Brown’s response (79%) and disapprove of Trump’s (89%), while Republican’s approve of the president’s response (86%) but disapprove of the governor’s (78%).
With the recent start of the school year, and nearly all students attending remotely, perhaps the more interesting finding is that 57% of Oregon voters approve of the way that their local school district has responded to COVID-19. The difference between parents and those without children is small (and not statistically significant) but voters with kids at home are somewhat more likely to approve (63%) than those without children (54%).
Pharmaceutical companies are one of Americans most disliked institutions. Yet, there is also great hope that an effective and widely available COVID-19 vaccine can put an end to the ongoing pandemic and allow us to return to normal life.
With these conflicting feelings, 46% of Oregon voters approve of pharmaceutical companies’ COVID-19 response, 36% disapprove, and 17% are unsure. Unlike views of political leaders, there is little difference by political party or presidential candidate support. The largest differences are by age with an 18-point gap in approval between younger and older voters. Specifically, 39% of voters ages 18-29 approve of pharmaceutical companies’ response versus 57% of voters ages 65+.
DHM Panel–Presidential and COVID memo–September 2020.pdf DHM Panel Survey–Presidential and COVID_tables–September 2020.pdfResearch Methodology: The online survey consisted of 502 Oregon voters and took approximately 15 minutes to complete. This is a sufficient sample size to assess Oregonians’ opinions generally and to review findings by multiple subgroups.
Respondents were contacted by using a professionally maintained online panel. In gathering responses, a variety of quality control measures were employed, including questionnaire pre-testing, validation, and real time monitoring of responses. To ensure a representative sample, demographic quotas were set, and data weighted by gender, age, area of the state, political party and education to reflect the profile of the November general election turnout.
Statement of Limitations: Any sampling of opinions or attitudes is subject to a margin of error. The margin of error is a standard statistical calculation that represents differences between the sample and total population at a confidence interval, or probability, calculated to be 95%. This means that there is a 95% probability that the sample taken for this study would fall within the stated margin of error if compared with the results achieved from surveying the entire population. This survey’s margin of error, for the full sample, is ±4.4%.
DHM Research: The research was conducted by DHM Research, an independent and nonpartisan public opinion research firm based in Portland, Oregon. DHM is a Certified B Corporation.
For inquiries, please contact John Horvick, DHM Research Director of Client Relations and Political Research, at jhorvick@dhmresearch.com or 503.757.3051.
September 10, 2020
From September 3 to 8, 2020, DHM Research conducted a survey of Oregon voters. The purpose of the survey was to assess values and beliefs related to the presidential election, ongoing protests across the country and in Portland, and COVID-19.
This is the first of three planned data releases that focuses on Oregon voters’ opinions about the protests that have been ongoing since the death of George Floyd in May.
A majority of Oregon voters (56%) believe that the state is on the wrong track, while just 31% think we’re headed in the right direction.

After months of COVID-19 lockdowns and restrictions, job losses, protests, and now an explosion of forest fires, Oregonians are unhappy. In the pre-pandemic months, right direction percentages hovered in the high-40s to low-50s, which was about average for the last two decades. In the first days of COVID-19 right direction percentages fell to 40% but then bounced up to 51% in April. This rise in positive outlook was a trend across the country, and even the globe, as people rallied around their communities and leaders. However, it didn’t take long for the new realities to sink in and now most Oregonians feel like we’ve lost our way.
Every area of the state reports feeling negatively, with majorities in the Portland metro area (54%), Willamette Valley (50%), and the rest of the state (63%) believing that Oregon is on the wrong track.As always, perceptions of Oregon are driven by partisanship with Democrats and Republicans seeing very different versions of the state. Currently, 48% of Democrats say that the state is headed in the right direction compared to 18% of Republicans, and 23% of non-affiliated/other voters (NAV/other).
Oregon voters name the ongoing protests as the most important issue that they would like their state leaders to address.
When asked an open-ended question to name the most important issue that they would like their state leaders to address, more voters mentioned something about the ongoing protests (30%) than any other issue. In fact, about twice as many mentioned protests compared than COVID-19 (16%) or the economy (13%). Addressing racism was mentioned by 7% of voters and police reform by 5%. Racism and police reform were mentioned significantly more among voters ages 18-29 (17% and 14% respectively).
A majority of Oregon voters disapprove of how all major elected leaders have responded to the ongoing protests across the United States and Oregon.

Nearly six in 10 Oregon voters disapprove of how President Donald Trump (59%), Governor Kate Brown (57%), and Portland Mayor Ted Wheeler (58%) are responding to the ongoing protests.
There are large demographic and partisan differences in opinions. For Trump, 86% of Republicans approve of his response compared to just 10% of Democrats and 33% of NAV/other. Conversely, Democrats tend to approve of Brown’s response (63%) while few Republicans (11%) and NAV/other(27%) approve. Partisan differences are less extreme for Wheeler with 48% of Democrats approving of his response versus 13% of Republicans and 23% of NAV/other.
Support for Wheeler’s response the protests is higher among voters of color (41%) than it is among White voters (28%). It is also somewhat higher among voters with a college degree (38%) than it is with those with less education (23-27%). The differences of opinion about Wheeler by area of the state are relatively small. Approval is greater in the Willamette Valley (36%) and the Portland metro area (32%) than the rest of the state (24%).
Voters are split in their opinions about how the Portland Police have responded to the protests.

While there have been protests across the state, nowhere have they been as sustained and attention-grabbing as Portland. For over one hundred days protesters and Portland police officers have engaged and at times their interactions have turned violent. Although protests have been mostly confined to small areas of Portland, the images of the nightly events have had a statewide and national audience.
Overall, 46% of Oregon voters approve of the Portland Police response to the ongoing protests and 45% disapprove. Metro area voters’ assessment of the Portland Police are similar to other Oregonians with 46% approving of their response and 49% disapproving.
There are large differences in approval by race and age. 50% of White voters approve of the response of the Portland Police compared to 26% of voters of color. Approval steadily increases by age from just 21% of those ages 18-29, to 37% ages 30-44, 52% ages 45-64, and 59% ages 65+.
Two-thirds of Oregon voters disapprove of the ongoing protests in Portland and few believe that they have been helpful to Black Portlanders, race relations, or efforts to make police reforms.

By a margin of more than two to one, more Oregon voters disapprove (66%) of the protests in Portland than approve of them (31%). In the Portland metro area specifically, 61% disapprove and 36% approve.
Voters ages 18-29 are the only group to approve of the protests, with 62% saying that they approve compared to 33% who disapprove. Voters of color are split in their assessments with 49% approving and 46% disapproving.
Beyond general approval, voters were asked if the protests in Portland have been more helpful or harmful to Black Portlanders, race relations, and efforts to make police reforms. On all accounts, most voters do not believe that the protests are helpful. Just 28% believe that they are helpful to Black Portlanders, 24% to race relations, and 27% to efforts to make police reforms.
However, there are important demographic differences, most notably by age and race. For example, 52% of voters ages 18-29 and 51% of voters of color believe that the protests in Portland are helping Black Portlanders. Voters of color, however, are less likely to believe that the protests are helping race relations (39%).

A majority of Oregonians believe that the protests in Portland have been mostly violent. At the same time, just 29% feel that the Portland police have used too much force.

When presented the choice, 56% of Oregonians believe that the protests in Portland have been mostly violent while 36% think that they have been mostly peaceful, and 7% are unsure. As elsewhere, there are large partisan differences in voter assessments. 57% of Democrats believe that the protests have been mostly peaceful compared to 83% of Republicans who say that they have been mostly violent.

Oregon voters are more likely to believe that police in Portland have not used enough force (42%) in their response to protesters than believe that they have used too much force (29%).18% think they have used the right amount and 11% are unsure.
Again, there are significant differences in opinion by age and race. 66% of those ages 18-29 think the police are using too much force while 54% of those ages 45+ believe that the police are not using enough. Similarly, 60% of voters of color feel that the Portland police are using too much force compared to 45% of White voters (a plurality) who say that they are not using enough.
A majority of Oregon voters believe that “riot” is a more accurate description than “protest” of the ongoing events in Portland.
Some have adopted the word “riot” to describe the ongoing events in Portland. This includes everyday people on social media, political leaders in speeches, and the media in news reports. However, it’s often not clear where a protest stops and a riot begins. At the end of the survey, we asked voters what word is a more accurate description of the events in Portland: 55% said riot and 37% said protest.
The voters most likely to say that “riot” is the more accurate description are Republicans (85%), those ages 45+ (63-68%), those living in rural Oregon (64%), and those who have a high school degree or less (63%). The voters who say that “protest” is more accurate are those ages 18-29 (67%), Democrats (57%), and those who have a college degree (46%).
DHM Panel–Protests memo_final–September 2020.pdf DHM Panel–Protests memo_tables–September 2020.pdfResearch Methodology: The online survey consisted of 502 Oregon voters and took approximately 15 minutes to complete. This is a sufficient sample size to assess Oregonians’ opinions generally and to review findings by multiple subgroups.
Respondents were contacted by using a professionally maintained online panel. In gathering responses, a variety of quality control measures were employed, including questionnaire pre-testing, validation, and real time monitoring of responses. To ensure a representative sample, demographic quotas were set, and data weighted by gender, age, area of the state, political party and education to reflect the profile of the November general election turnout.
Statement of Limitations: Any sampling of opinions or attitudes is subject to a margin of error. The margin of error is a standard statistical calculation that represents differences between the sample and total population at a confidence interval, or probability, calculated to be 95%. This means that there is a 95% probability that the sample taken for this study would fall within the stated margin of error if compared with the results achieved from surveying the entire population. This survey’s margin of error, for the full sample, is ±4.4%.
DHM Research: The research was conducted by DHM Research, an independent and nonpartisan public opinion research firm based in Portland, Oregon. DHM is a Certified B Corporation.
For inquiries, please contact John Horvick, DHM Research Director of Client Relations and Political Research, at jhorvick@dhmresearch.com or 503.757.3051.
August 21, 2020
On May 25, 2020, George Floyd, a 46-year-old Black man, was killed in Minneapolis, Minnesota, by a police officer, which has led to a call for action across the country to end racial inequality and police brutality. People across the globe continue to support the Black Lives Matter movement and there has been increased demands to reform, defund, or abolish the police. In this month’s panel, DHM Research explored the attitudes and beliefs that Oregonians have towards the police, protests, and some of the changes being proposed.
These findings come from the July 2020 fielding of our DHM Panel. The survey was conducted from July 14 to 22, 2020, and surveyed 603 Oregonians. The results were weighted by age, gender, area of the state, political party, and level of education to ensure a representative sample of Oregonians ages 18+. The margin of error for this survey ranges from ±2.4% to ±4.0%.
Oregonians’ support for the Black Lives Matter movement has increased since 2018.
Two thirds of Oregonians (66%) now support the Black Lives Matter movement (BLM); this represents a 12-point increase from when we asked this question back in May of 2018. Support for BLM is higher in Oregon than in the rest of the nation as a whole. About half of Americans support BLM, according to a national survey conducted by Civiqs, and support has increased nationally over this same time period.

Support for BLM varies by age, region, and party. Differences by political party are particularly stark. 91% of Democrats and 64% of NAV/other voters below the age of 30 (92% among those ages 18–29) compared to those ages 30 and above (53%–69%). Finally, support is higher in the Portland metro area (72%) than in the rest of Oregon (61%–63%).
Oregonians are having conversations about race, racism, and policing (and that’s not all).
55% of Oregonians report that they’ve talked with family or friends about racial injustice since the death of George Floyd. Oregonians have also taken other forms of action such as posting on social media (28%), signing a petition (24%), donating money (17%), and attending a protest or demonstration (12%).

Oregonians who have taken action most often attribute it to dialogue and open communication being good (27%) and wanting to support the movement (18%).
Among all of the actions asked, younger Oregonians and Democrats are the most active in showcasing support for the Black Lives Matter movement; they’re particularly more active in talking with family or friends about racial injustice (14 point increase), posting on social media about racial injustice (20 point increase), and signing petitions (21 point increase).
Although many have taken action, over a third of Oregonians have not (36%). Generally speaking, those who do not support BLM are less likely to have taken action in response to recent events.

Two-thirds of Oregonians support the protests held around the country in response to the death of George Floyd.
67% of Oregonians support the recent protests held in response to the death of George Floyd at the hands of police. Still, almost a third (29%) of Oregonians oppose these protests.
Similar to the Black Lives Matter movement, support for the protests is strongest among Democrats (86%) and younger Oregonians (18-29: 82%), while a majority of Republicans (57%) oppose the protests.

Half of Oregonians disapprove of the way police have responded to the protests.
53% of Oregonians disapprove of how police have responded to the protests, while one-third (35%) approve of their response. Differences are notable by age and political affiliation.
Those ages 18-29 (70%) are more likely to report disapproval of recent police behavior, while those over the age of 45 are more split in their views. Democrats (68%) and NAV/Other (51%) disapprove of the police’s response to protests considerably more than Republicans (28%).
Oregonians aren’t sure how violent protests are and who incites violence at protests when it occurs.
Half of Oregonians (50%) think that the protests have been both peaceful and violent, while 27% believe the protests have been mostly peaceful and 19% believe they’ve been mostly violent. Points of view vary most significantly by political affiliation.
Republicans (44%) are more likely to report the protests as violent, while Democrats report protests being more peaceful at a higher rate (48%).
Likewise, there’s no consensus among Oregonians as to who is stirring up violence when it happens. A plurality of Oregonians (34%) believe the violence at protests is due to people other than protestors acting irresponsibly. About a quarter (24%) believe the violence is incited by protestors and 15% say that police are to blame for violence. An additional 21% say the blame is shared among these groups.
Oregonians are less optimistic than Americans about the prospect for meaningful reform.
A plurality of Oregonians are unsure (38%) if the recent protests calling to end racial inequality will lead to meaningful reform, while the remainder are split (31% yes and no) as to what the future holds.
In contrast, national research by Quinnipiac University Poll found that over half (55%) of Americans believe the protests will lead to meaningful reform, while 38% disagree and 7% were unsure.

In Oregon, opinions are widely divided by political affiliation, area of the state, and age. Democrats (48%) are more likely to believe meaningful reform will happen, while few Republicans (8%) hold this belief; NAV/Other (34%) align more closely with Democrats.
Portland metro residents (38%) are more optimistic about meaningful reform than those in Willamette Valley (27%) and the rest of the state (24%). Those ages 18-29 (39%) are more likely to believe meaningful reform will happen as a result of the protests than those ages 45-64 (26%).
Oregonians are concerned about the potential impact of protests on the spread of COVID-19.
Almost two thirds of Oregonians (64%) are concerned that the recent protests may lead to an increase in coronavirus cases. In a seemingly rare moment of consensus, these concerns are shared across all demographic groups. Those in the tri-county area are slightly more worried (71%) than others.
DHM-OVBC-July-Survey-Injustice_Policing-July-2020August 13, 2020
COVID-19 is creating complex challenges for schools in Oregon and across the country, from physical safety to the effectiveness of remote learning. Due to the economic impacts of COVID-19, many school districts may also be faced with financial problems. The decline of state and local revenue could force schools to layoff teachers and/or delay hiring.
In addition, the ongoing protests in response to the death of George Floyd have given new urgency to the issues of racial injustice. Schools are hearing these demands and considering ways to increase the diversity of teachers in the classroom and develop curriculum that represents and meets the needs of all Oregon students.
These findings come from the July 2020 fielding of our DHM OVBC Panel. The survey was conducted from July 14 to 22, 2020, and surveyed 603 Oregonians. The results were weighted by age, gender, area of the state, political party, and level of education to ensure a representative sample of Oregonians ages 18+. The margin of error for this survey ranges from ±2.4% to ±4.0%.
Oregonians reject public school hiring and retention policies that prioritize teachers’ length of service over performance.

We asked Oregonians about hiring and retention practices several ways in the survey, starting with their support or opposition to a practice commonly called “last hired, first fired.” This is a policy that, when making budget cuts, prioritizes retaining teachers who have the longest tenure, while the teachers that were most recently hired are the first to be let go. Just 20% of Oregonians support “last hired, first fired,” while 69% oppose it and 10% are unsure.
Unlike many policy issues, there are not significant differences in opinions between Democrats and Republicans. 69% of Democrats and 67% of Republicans oppose “last hired, first fired,” as do 75% of NAV/Other voters.
While this practice is opposed by every demographic group, there are modest differences in support levels by educational attainment. 27% of Oregonians with a high school degree or less support “last hired, first fired” compared to 20% of those with 2-year degree/some college and 13% of those with a 4-year degree. As we’ll see, this difference in education appears in other attitudes about teaching and curriculum.
Oregonians agree teachers should be retained based on their performance in student academic growth rather than how many years they have been teaching.

The flip side of “last hired, first fired” is a policy that prioritizes retaining teachers based on performance when budget cuts require reducing staff. 81% of Oregonians agree with this approach, while just 12% disagree. Again, there is little difference by party with 83% of Democrats, 79% of Republicans and 85% of NAV/Others in agreement. Though it is only a modest difference, Oregonians with more education are more agreeable than those with less education (84-85% of 2-year/some college and 4-year degree vs. 76% of high school or less).
Opinions about these hiring and retention practices may not be fixed. Oregonians are open to the idea that long-term teachers should be protected from being replaced by lower wage teachers.
Some say that “last hired, first fired” protects teachers who have given years of service to a school. Without this protection, school districts would have the incentive to replace higher wage, longer tenured teachers with lower wage, less experienced teachers.
With this in mind, we asked Oregonians if they agreed or disagreed with the statement: Teachers with seniority need to be protected, otherwise, they will be forced out of their jobs since newer and less experienced teachers are paid less. A majority, 51%, of Oregonians agreed with this statement compared to 37% who disagreed and 12% who were unsure.
Differences across the parties are somewhat greater on this question, with more Democrats (56%) and NAV/Others (52%) agreeing to the statement then Republicans (40%).
The differences by education level persist and there are also differences by income. Lower income Oregonians are more in agreement with this statement than those with higher incomes. Specifically, 59% of Oregonians with a high school degree or less agree to this statement compared to 45-46% of those with more education. Similarly, 57% of Oregonians with incomes below $25,000 agree versus 43-47% of those with incomes above $50,000.
Oregonians are split about the need for more teachers of color, with sharp differences by political party and other demographic groups.

Overall, 55% of Oregonians agree that schools in the state need to hire more teachers of color to better reflect the increasing number of students of color in the classroom, while 29% disagree and 16% are unsure.
Unlike “last hired, first fired” policies, when it comes to hiring for racial diversity there are large partisan differences with Democrats on one side, Republicans on the other and NAV/Other falling in between. Specifically, 80% of Democrats agreed with this statement compared to 26% of Republicans and 49% of NAV/Other.
Education level is correlated with the idea that it is important to hire more teachers of color. Two-thirds (66%) of Oregonians with a 4-year degree agreed, while just about half of those (49-52%) with less education agreed. By geography, 63% of Oregonians who live in the Portland metro area agree to this statement, which is higher than those who live in the Willamette Valley (45%) and the rest of the state (52%).[1]
Notably, these differences by party, education and geography are greater than the differences by race. 60% of Oregonians from communities of color and 54% of white residents agree with this statement.
Most Oregonians agree that school curriculum needs to include culturally specific context and experiences.
61% of Oregonians agree with the statement that school curriculum and learning needs to include culturally specific content and experiences, 25% disagree and 14% are unsure. Like teacher diversity, support is highest among Democrats (83%), college graduates (72%), and residents in the Portland metro area (73%). Also, like teacher diversity, there is little difference between communities of color (64%) and white residents (61%).
Despite overall support for teacher and curriculum diversity, most Oregonians do not consider these as high priorities for schools.
[1] Some Oregon counties outside of the Portland metro area and Willamette Valley have the highest percentages of non-white populations, particularly Jefferson, Morrow, Malheur, Hood River and Umatilla counties.

Just 49% of Oregonians believe think that culturally inclusive and relevant curriculum should be a priority population. Even fewer (42%).think that it should be a priority to have diverse teachers who reflect the student population. Oregonians rate these as lower priorities than other education needs, including creating a sense of belonging for all students (73%) and supporting students’ social emotional learning.
These issues—sense of belonging and social emotional needs—are certainly connected to the teachers in the classroom and the materials students are taught. There are opportunities to increase support for hiring and curriculum diversity by connecting these policies directly to students’ well-being.
The research was completed as a community service by DHM Research in partnership with the Oregon Values and Beliefs Center. Both organizations are independent and non-partisan. DHM Research is a Certified B Corporation and OVBC is an Oregon charitable nonprofit corporation.
DHM OVBC July Panel_Education Blog Post Annotated — July 2020.pdfJuly 31, 2020
On May 25, 2020, George Floyd, a 46-year old Black man, was killed in Minneapolis, Minnesota, by a police officer and has since spread a call for action across the country to end to racial inequality and police brutality. People across the globe continue to support the Black Lives Matter movement and demand to reform, defund, or abolish the police. Political leaders have looked towards implementing policy changes that meet the demands of the continued protests. Some of these policy changes have directly targeted the decrease of police funding, while others have demanded more specific changes such as the banning of chokeholds by law enforcement officers. In this month’s panel, DHM Research explored the attitudes and beliefs that Oregonians have towards the police, protests, and changes being asked across the country.
These findings come from the July 2020 fielding of our DHM OVBC Panel. The survey was conducted from July 14 to 22, 2020, and surveyed 603 Oregonians. The results were weighted by age, gender, area of the state, political party, and level of education to ensure a representative sample of Oregonians ages 18+. The margin of error for this survey ranges from ±2.4% to ±4.0%.
Oregonians approve of the police in their community more than police in the
United States.
55% of Oregonians approve of the way police in their community are doing their job. Approval drops to 40% when asked about the job performance of police in the United States broadly. It’s not uncommon for people to give better ratings for issues closer to home versus elsewhere.

Differences are wide by age and political affiliation. Older Oregonians (45-64, 53%) are more likely to report approval for police in the United States than those under the age of 30 (18%). A large majority of Republicans (80%) approve of the job the United States police are doing, while Democrats (22%) and NAV/Other (35%) are significantly less supportive.
Oregonians who disapprove of the job performance of police across the country attribute it mainly to excessive violence (39%), racism (22%), and abuse of power (20%). Those who approve attribute it to policing being a tough job (35%), there only being a few bad cops (27%), and most police officers being well trained and professional (23%).
Do police treat white people and Black people equally?
Slightly over half of Oregonians (55%) believe that police treat white people better than Black people, while almost a third (30%) hold the view that police treat white people and Black people equally. 1% of Oregonians believe the police treat Black people better.
Most Oregonians (62%) also believe the deaths of Black people during encounters with the police are signs of a broader problem, and again almost a third (29%) believe these are isolated incidents.
Those in the Portland metro (72%) are more likely to report this being signs of a broader problem, while those in Willamette Valley (54%) and the rest of the state (54%) are less convinced.
Democrats (86%), those under the age of 30 (72%), and people over age 65 (71%) are more likely to report that the deaths of Black people during encounters with the police are signs of a broader problem than those ages 45-64 (53%) and Republicans (26%). The shared views from our youngest and oldest Oregonians may be due to the fact that younger people have been taking the lead on these protests against racial inequality and those 65+ see similarities between what they experienced during the Civil Rights movement and now.


Now more than ever, a majority of Oregonians acknowledge the need and urgency for state leaders to look at the intersection of race and policing. These issues about policing, race, and racism are important and they will require leaders to address current policies and public safety measures.
Oregonians are split between police reform and reinventing our approach to
public safety.
Seven out of ten (70%) Oregonians believe that some sort of change needs to happen with police departments. More than half of those who believe that change is needed (39%) believe that police departments have a problem with race, but it can be fixed by reforming the existing system. Others who believe in change (31%) also believe that reform hasn’t worked in the past and we need to reinvent our approach to public safety.

In early June, a national survey was conducted by YouGov Poll that asked participants which statement came closest to their view on police reform. The results indicate that a majority of the nation believes that we can fix the problem with race, by reforming the existing system (59%). However, panel results indicate that Oregonians are more split in their belief to defund the police (31%) or reform the existing system (39%). Points of view vary by political party, education, and age.
Democrats (49%), college graduates (39%), and Oregonians younger than age 45 (45%) are more likely to believe that we need to defund the police and reinvent the way that we approach public safety.
Oregonians older than age 45 plus (46%) are more likely to believe that reforming our current system will fix the problem we have with race. Half of the Republicans (50%) believe that police departments don’t need to be reformed.
Requiring police intervention, reporting of force, and publicly releasing disciplinary records receive the most support amongst various changes to policing and public safety.
There is overwhelming support for changes to policing and public safety when focusing on police accountability. Some of these changes include requiring police to intervene when other officers are using excessive force (91%), requiring officers to report each time they use force against a civilian (81%), and requiring states to publicly release disciplinary records for law enforcement officers (76%).

The strongest degree of support for these changes are shown by Democrats (89% or more), college graduates (80% or more), and Oregonians between the ages 18–29 (81% or more). While small amounts of opposition are likely from those who identify as Republican (33% or less), have a high school diploma or less (16%), and are older than 65 years of age (21%).
How much funding should we shift to social services?

Oregonians believe that an average of 22%, with a median value of 15%, of the police budget should be allocated towards social services. Democrats and NAV/Other voters are more likely to provide a percentage that is within 10% or more of the average. While Republicans are more likely to provide a percentage that is lower than the average. It is also more likely that Republicans (73%) would oppose allocating any funds to social services.
Alternatives to Justice
Restorative and transformative justice provide two possible alternatives in how we shape the criminal justice system. However, six out of ten Oregonians are not familiar with either concept.


After providing a definition for each approach to justice, a majority (67%) of Oregonians say that they would support using these principles to reshape the criminal justice system. Levels of support vary by political party, and approval of the police in the US.
Democrats (83%) and NAV/Other voters (70%) are more likely to support using these methods while Republicans (40%) are less likely to support using these methods.
Furthermore, those who disapprove of policing in the US (82%) also support these methods at a greater rate than those who approve of policing in the US (48%).
Although the split in partisanship is not surprising, the supporting majority of these changes indicate that a change in policing and public safety is possible.
The research was completed as a community service by DHM Research in partnership with the Oregon Values and Beliefs Center. Both organizations are independent and non-partisan. DHM Research is a Certified B Corporation and OVBC is an Oregon charitable nonprofit corporation.
DHM-OVBC-Panel Police, Protests, Racial Injustice Survey –July 2020 Census Weighted Tables.pdf DHM OVBC-July Survey_summary memo – Police, Protests, Racial Injustice – July 2020.pdf