By this point, most of us have seen the headlines on results from this midterm season showing a lack of the forecasted “red wave” and higher turnout among younger voters who largely voted for Democrats. DHM Research conducted a post-election poll of Washington voters to understand these trends and gauge attitudes about various public policy topics from November 15-20. One-month post-election, we dive into the results to see how these trends presented in Washington.
Leading up to the election, many polls had the Senate race much tighter than how the results shook out.
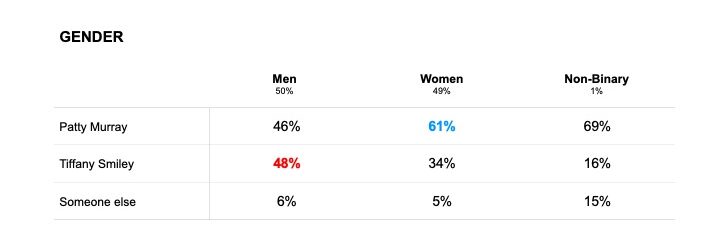
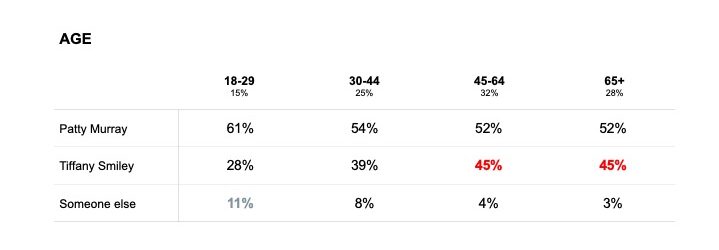
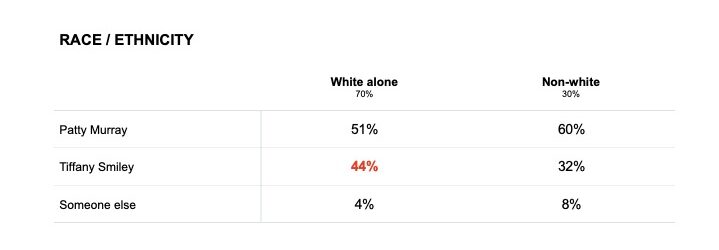
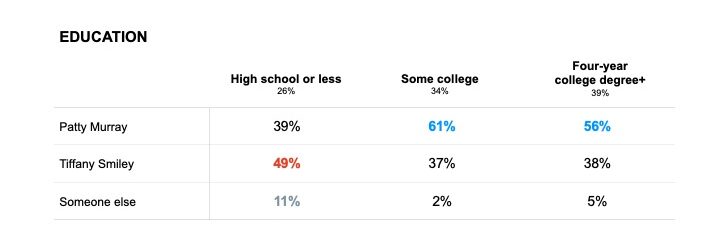
When we look at who reported voting for Patty Murray, we see higher numbers of women, younger voters, voters of color, voters with higher education levels, and Democrats. This provides key information on who is aligning themselves with the campaign messages and themes championed by each candidate and party in the state as we move towards the next general election, where we expect turnout to be even higher.
The “red wave” did not reach Washington’s shores, despite the Senate race being the most expensive congressional race in Washington’s history.
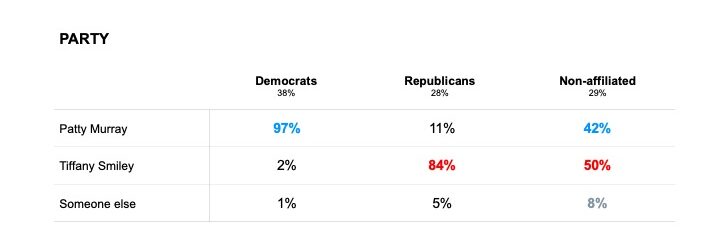
Murray was able to hold her Democratic base together more effectively than Smiley held Republicans. 97% of those who identified as Democrats voted for Patty Murray, and 86% of Washington Democrats voted only for their own party for the Senate and House of Representatives. In contrast, 84% of those who identified as Republicans voted for Tiffany Smiley, and only 69% of Republican voters voted only for Republicans. Non-affiliated voters were split. Among those who did split their votes on the ballot, most voted for a candidate of another party because they felt the incumbent was doing a good job (34%) or because the candidate was less polarizing than their party’s candidate (28%).
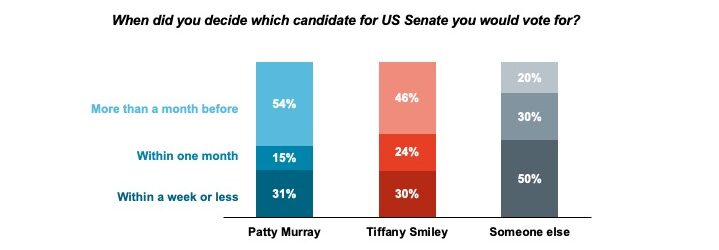
In some previous elections, late deciders have voted against the incumbent. But this November, late deciders voted the same as earlier deciders.
Nearly a third of those who voted (31%) said they decided who to vote for in the last week or final days before the election. A similar proportion of Murray (31%) and Smiley (30%) voters decided within the final week, but among all late deciders, more voted for Murray (53%) than Smiley (39%), similar to overall results for that race.
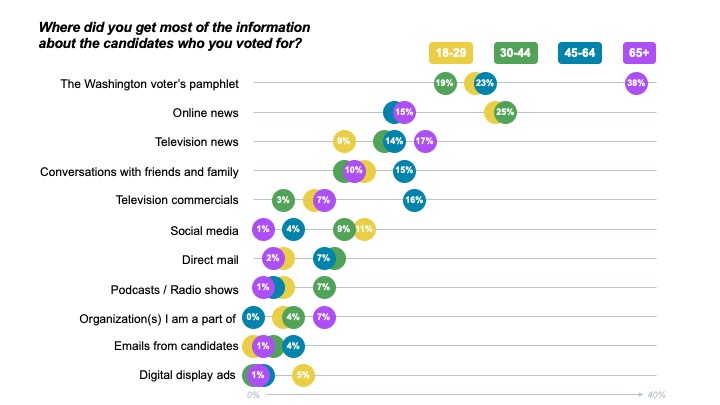
Looking to future elections, online news is the best media source to reach tomorrow’s voters where they’re most comfortable.
Voters mostly got information on the candidates they chose from the voter pamphlet (26%), online news (19%), and television news (14%). However, younger voters and voters of color were more likely to get information from online news (age numbers in chart below; 26% among people of color vs. 16% among white voters) while middle aged voters (45-64) were the most likely to get information from television commercials. Given the high rate of spending in this year’s Senate race, as candidates and organizations vie for voters’ attention in the next election cycle, it’s important to know not only where you’ll get the most bang for your buck, but where the voters you want to reach actually spend their time.